Graphing Functions Worksheets
How to Graph a Function
Graphing functions often require making a pattern. A pattern is anything that repeats itself, i.e., a particular action taking place again and again at regular intervals. In this way, a straight line is a pattern where all the points that are connected with each other are formed on the same plane.
Suppose you have an equation to graph x + y = 7. The equation means that when the two variables are added, you get 7. They can 1 and 6, 5 and 2, 4 and 3 or 7 and 0. Given that we put these numbers in the form of a table and start plotting them accordingly, we will get a pattern that will be represented in the form of a straight line.
Plotting the graph for x + y = 7:
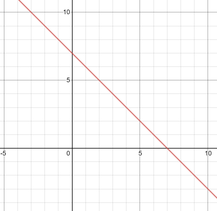
The pattern, in this case, is evident as when we join all the points, it forms a straight line.
-
Basic Lesson
Demonstrates how to graph linear functions. Practice problems are provided. Linear Functions are straight lines defined by the equation: y = mx + b If m is positive, the line slants upwards. As value of m increases the line tends to becomes vertical with extremely large value of m.
View worksheet -

Intermediate Lesson
Explores how to graph the absolute value of a function and exponential functions. Practice problems are provided. Absolute Value of function graph takes a V shape and is defined by: y = |x|. As the coefficient of x gets larger, the graph becomes thinner, closer to its line of symmetry.
View worksheet -
Independent Practice 1
Contains 20 Graphing Functions problems. The answers can be found below.
View worksheet -
Independent Practice 2
As the value of m gets smaller closer to zero the line tends to become horizontal. If m is negative the line slants downhill. By placing any two points of a line into the equation y = mx + b you can determine the equation that it represents.
View worksheet -
Homework Worksheet
12 Graphing Functions problems for students to work on at home. Example problems are provided and explained.
View worksheet -
Topic Quiz
What type of function is graphed below? A math scoring matrix is included.
View worksheet -
-
Fun Fact:
John Napier's study of mathematics was only a hobby. He often wrote that he found it difficult to find time for the necessary calculations between working and theology.