Graphing Inequalities Worksheets
How to Graph Inequality - A statement of an order relationship in mathematics is what we term as inequality. It includes relating two expressions using "greater than," "less than," "greater than or equal to," or "less than or equal to." The good thing about these inequalities is that these can be solved just like algebraic equations and all geometrical theorems apply on these inequalities. So, we know how we can solve inequalities, but how do we graph inequality? Sounds complicated? Well, it is not. Here is how you can graph an inequality with ease. Step 1: Rearrange the inequality in the general straight-line form. -Consider the inequality; 3x + y ≥ 3. And you know that the generally straight-line equation looks like; y = mx + b. To rearrange the inequality, subtract 3x on both sides. The final inequality will look like; y ≥ 3 - 3x. Step 2: Identify the Slope and y-intercept - The next step is to observe the rearranged inequality and identify the slope that is "m" and the y-intercept, that is "b." Here, m = -3 and b = 3. Step 3: Find the x-intercept - Remove the inequality sign, replace it with an "equals to" sign to find the x-intercept. To find the x-intercept, replace y with a 0 and find the value of x. Step 4: Plotting - Use the y-intercept and the x-intercept to start plotting. Once plotted, make a straight line connecting these two points. You will use a dashed line only when there is "greater than" or "less than" sign and a solid line when there is "greater than or equal to," or "less than or equal to" sign. Once you have graphed the inequality, you need to shade the area it covers. If it has a greater than sign, you shade the area above the line; if it includes a lesser than sign, you will shade the area that lies below the plotted line.
-
Basic Lesson
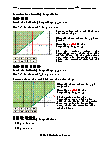
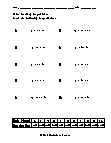
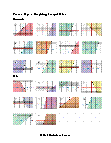
Demonstrates how to graph inequalities and shaded quadrants. Practice problems are provided.
View worksheet -
Intermediate Lesson
Explores how to graph inequalities if the inequality is greater than or less than. Practice problems are provided.
View worksheet -
Independent Practice 1
Contains 20 Graphing Inequalities problems. The answers can be found below.
View worksheet -
Homework Worksheet
12 Graphing Inequalities problems for students to work on at home. Example problems are provided and explained.
View worksheet -
Basic Lesson
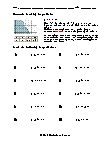
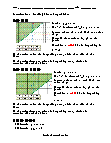
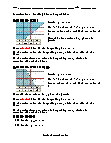
Demonstrates how to graph linear inequalities and shaded quadrants. Practice problems are provided.
View worksheet -
Intermediate Lesson
Explores how to graph linear inequalities and the use of dashed or solid lines. Practice problems are provided.
View worksheet -
Independent Practice 1
Contains 20 Graphing Linear Inequalities problems. The answers can be found below.
View worksheet -
Homework Worksheet
12 Graphing Linear Inequalities problems for students to work on at home. Example problems are provided and explained.
View worksheet -
Topic Quiz
10 Graphing Linear Inequalities problems. A math scoring matrix is included.
View worksheet
How to Graph a Linear Inequality
Inequality is a relationship between two expressions. These inequalities have "greater than," "less than," "greater than or equal to," or "less than or equal to," signs in place of a simple "equals to" sign. You can solve inequalities just as you solve algebraic equations.
Linear inequalities are where the highest power on the variable is 1.
You need to start by rearranging the inequality to make it look like a generally straight line equation that we know looks like; y=mx+b.
Remember, when you multiply the entire inequality with a negative sign, the inequality sign changes. The greater than sign becomes lesser than, and vice versa.
Once you have rearranged the inequality, it is time to plot it on the graph. You know the -intercept, and you need to calculate the x-intercept. Plot the points on the graph and draw a straight line, a dashed line in case the inequality contains a "greater than" or "less than" sign, a solid line if there is a "greater than or equal to" or "less than or equal to" sign.
Once the line has been drawn, identify the area that the inequality satisfies. If there is a "greater than" sign, you will shade the area lying above the line, and if there is a "less than" sign, you will shade the area lying below the line.
Fun Fact
Famed mathematician Lewis Carroll (aka Charles Lutwidge Dodegerson), was also known for adding words to the English language including "chortle."
When Pierre De Fermat wrote the "last Theorom" no one was able to solve it for over 300 years until British mathematician Andrew Wiles solved it in 1994.
