Plotting Ordered Pairs on a Coordinate Graph Worksheets
How to Graph Coordinates - After you have learned and understood the definition of coordinate graphing, it is now time to move on to the next step, which is learning about how to graph coordinates or ordered pairs on a plane. Remember that before you start plotting the points on the plane, a point on the coordinate plane is allotted according to its value in the ordered pair. The first value in the pair is known as the x-axis, whereas the second value in the point is known as the y-axis of the ordered pair. To graph an ordered pair on the coordinate plane, consider following the below-mentioned steps: Draw a dot on the coordinate plane that corresponds to the values mentioned in the ordered pair. Start with the origin. The values of the pair will guide you through the small squares and tell you exactly how many steps to take to plot the pair on hand. The x-coordinate helps you with moving in the right (positive) and left (negative) direction. The y-coordinate helps you with moving up (positive) or down (negative) direction. Also, it is a good practice to remember that the first coordinate, the x-axis is called the domain, and the second coordinate, which is the y-axis, is called the range.
-
-
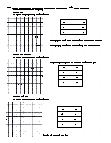
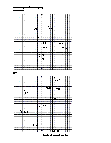
Independent Practice 1
10 ordered pairs to plot on a large coordinate graph. Complete the graph using the data below. The answers can be found below.
View worksheet -
-

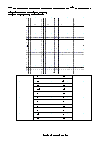
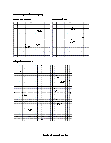
Homework Worksheet
Draw the ordered pairs on the grid. An example is provided and explained.
View worksheet -
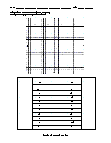
Skill Quiz
10 drawing coordinate graphing problems. A math scoring matrix is included.
View worksheet -
-
Horror Movies
I heard they are making a new horror movie with a mathematician as the villain. Yes, he goes on a killing spree with a pair of axes! Get the play on words?