Venn Diagrams Worksheets
How Are Venn Diagrams Used in Math? A Venn diagram is a visual organizer of information presented in groups or sets. It is a way of graphically organizing or representing complex relationship between two or more entities. It allows abstract ideas to be more visibly understood. Venn diagram is primarily used as a thinking tool and can also be used for assessment. Students in their early academic stages get familiar with the concept of Venn diagrams. Let’s learn when to use a Venn diagram. The key function of a Venn diagram is to contrast and compare groups or sets of things with each other. For example, a statement like all thumbs are fingers but not all fingers are thumbs. This shows that thumb is a subset of fingers. Venn diagram are useful assessment tools because they are able to generate valuable discussions on critical subjects. It also helps teachers in understanding how their students think.
-
Basic Lesson
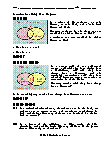
Guides students through determining the Using Venn Diagrams by using various equations. In a class of 38 students, 17 take Chorus, 21 take Band, and 7 take both Chorus and Band. How many students in the class are not enrolled in either Chorus or Band?
View worksheet -
Intermediate Lesson
Demonstrates how to decipher the know parts of a polygon. The 13 students scored above 50% on the Math test, 22 students scored above 50% on the Science test, and 6 students scored above 50% on both Math and Science. How many students scored above 50% either on math or on science?
View worksheet -
Independent Practice 1
A really great activity for allowing students to understand the concepts of the Using Venn Diagrams. Example: In a recent poll of 500 registered voters, 35% said they have always been a Republican, 48% said they have always been a Democrat, and the remaining respondents said they have switched from one party to another at some point in their lives. How many people said they have always been a Republican?
View worksheet -
Independent Practice 2
Students determine the Using Venn Diagrams in 20 assorted problems. The answers can be found below. Example: 100 people seated at different tables in a Mexican restaurant were asked if their party had ordered any of the items nachos, or quesadillas. 20 people had ordered none of these items, 58 people had ordered quesadillas and 64 people had ordered nachos. How many people had ordered both items?
View worksheet -
Homework Worksheet
Students are provided with 12 problems to achieve the concepts of Using Venn Diagrams. Sample problem: 60 tennis players were asked which of these strokes they considered their weakest stroke(s): their backhand or forehand. 8 players said none of these were their weakest stroke, 25 players said that forehand were their weakest strokes, 32 players said that backhand were their weakest strokes. How many players said their forehand and backhand their weakest stroke?
View worksheet -
Skill Quiz
This tests the students ability to understand Using Venn Diagrams. Sample problem: A guidance counselor is planning schedules for 45 students. 18 students say they want to take Spanish, 22 want to take French, and 20 want to take Latin. 5 say they want to take both French and Latin, and of these, 1 wanted to take Spanish as well. 11 want only Latin, and 8 want only Spanish. How many students want French only?
View worksheet
Geometry one-liner:
What do you feed a hungry geometry teacher?
A square meal and don't forget the pi too!


