Bar Graph Worksheets
How to Read Bar Graphs -
A bar graph or a bar chart, as we call it today, is perhaps the most common way of demonstrating statistical data. It compares data in the form of bars. A bar graph breaks down data into groups and represents the data in bars of varying lengths. The bar either uses frequency (no. of people) or relative frequency (percentage of each group).
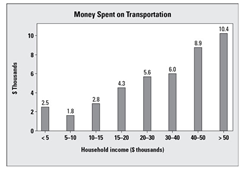
The above bar graph shows the data of American household income ($ thousands) and the money ($ thousands) they spend on their transportation per year. The first bar represents the people having household income $5000, and the amount they spent to commute is 2.5, which is $2,500. This is 50% of the total income. As we move to the right in the graph, the bar that representing $30 to 40K per year spends $6,000, which is Here, we note that as the household income increases, the people spending money on transportation also increases. This makes sense, because as the more people will earn, the more they will have on hand to spend on transportation.
Also, note that the groups of people who earn more spend more, but they don’t spend more as a percentage of their income.
How to Make Bar Graphs -
Just as we draw other forms of graphs, bar graphs are more or less similarly drawn and are pretty easy to construct and analyze. In bar graphs, the first thing that we do is define a key/legend. A key or legend states that how much distance on either of the axes will represent the count of a numeric value 1. For example, on a graph paper, a centimeter box can represent the count of 1 in case we are trying to plot the values of certain variables of an equation.
Once we have defined the key, the rest is pretty easy. All we have to do is solving the given equation for the values of its variables and plot the obtained numeric values on the graph. For example, if the coordinates of a point are (2,3), then it means that a vertical bar will be drawn on the x-axis at 2 and reach a height equal to the value 3 on the y-axis.
-
Basic Lesson
Students learn to make sense of bar graphs. Each bar represents one data point. The X (horizontal) axis provides different objects of comparison. The Y (vertical) axis provides the values for comparing the objects.
View worksheet -
Intermediate Lesson
Students begin to answer higher level questions based on bar graphs. Each column represents two groups. The bottom group indicates how many of one group. The top group indicates how many of a second group. The column indicates how many total in the category.
View worksheet -
Independent Practice 1
Students answer 10 questions and react based on bar graphs. Which location has highest level of ozone?
View worksheet -
-
Independent Practice 3
Questions based on a sales of books and population growth bar graph.
View worksheet -
-
Homework Worksheet
A series of real world related bar graphs provides a great home activity.
View worksheet -
-
-

-
Basic Lesson
Students learn to make sense of bar graphs. Example: The number of students at the university are: 1st year - 30, 2nd year - 20, 3rd- year 30, 4th year - 40 Draw a bar graph for the data? 1. First we draw a horizontal and a vertical axis. There are 4 values given, mark 4 points on horizontal line i.e. x- axis at equal intervals and erect rectangles of same width on these points. 2. The length of rectangles is proportional to numerical values of the data i.e. Number of Students
View worksheet -
Intermediate Lesson
Students begin to answer higher level questions based on bar graphs. What is the largest number of employees in the west zone?
View worksheet -
Independent Practice 1
Students answer 20 questions and react based on bar graphs. Which location has largest ozone consumption?
View worksheet -
-
Homework Worksheet
A series of real world related bar graphs provides a great home activity.
View worksheet -
-

-

What is the Purpose?
Bar graphs are used to compare things between different groups or to track changes over time. When trying to measure change over time, use bar graphs when the changes are larger. On line and bar graphs, label the x and y-axes with correct unit of measure.