Box and Whisker Plot Worksheets
What Are Box and Whisker Plots? Statistics is an area of mathematics which is the most used concept. However, as you probably know that in statistics, there are many values that are in the form of clusters. But, in this cluster of values, there should be an average. To find out the nature of such a dataset, box and whisker plots are used. By definition, the box and whisker plot is a graph that depicts from a five-number summary. It does not necessarily show a precise distribution; nevertheless, it shows which way the data is skewed. This graph is perfect for comparing distribution around a center value and for finding the measurement of data on an interval scale.
-

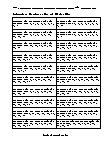
Basic Lesson
Using a snap shot of a random data students learn to field questions. The median is the middle value of a set of numbers, when the set is arranged in numerical sequence. Find the median of this set of numbers= 66 which averages less than the median of all averages and therefore lower quartile.
View worksheet -

-
-

-
-
-

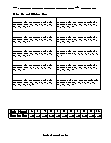
What We Learned...
You can create what is known as a box-and-whisker plot. Each section of numbers represents 25%. The five points used are: upper extreme, upper quartiles, median, lower quartile and lower extreme. They create a box-and-whisker plot, or simply, a box plot.