Reading Circle Graphs Worksheets
How to Read Circle Graphs? There is a plethora of different ways you can visually represent data. Dot and plot systems, bar graphs, histograms, line graphs, whisker plots, and pie charts. Pie charts are also sometimes referred to as the circle graphs. To understand what a pie chart looks like, consider a pizza that is cut into pieces. The pieces of this pizza represent the amount of data. Reading a pie chart is as easy as eating a pizza. Each piece of pizza or a pie chart is termed as a sector. just by looking at the size of the sector you can make a lot of evaluations of the data.
-
Basic Lesson
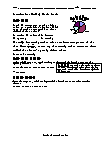
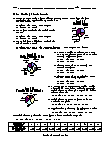
Using a snap shot of a random circle graph students learn to field questions. Graph #1 represents yearly ticket sales at a multiplex theatre. Which type of movie accounted for about 25% of ticket sales?
View worksheet -
Intermediate Lesson
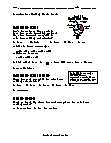
Students begin to answer higher level questions based on the circle graph. Joe's Convenience Store took in $720 last week. According to Graph #2, about how much money did he make from selling comic books?
View worksheet -
Independent Practice 1
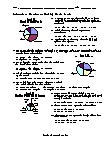
Students answer 10 questions using a random circle graphs. At Rory's school, students must join one after school club. Based on the data in Graph #2, which club attracted about 30% of students?
View worksheet -
Independent Practice 2
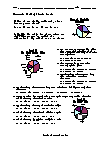
The questions on this one are to see if they are paying attention to what they are reading. A survey asked 300 students to name their favorite team sport. Based on the data in Graph #1, about how many students preferred baseball?
View worksheet
Three Pieces of the Pie
To make a circle graph with 3 "pie pieces," evaluate the size of each piece. For instance, say the first piece is 15/30 of the circle, the second piece is 9/30 and the last, 6/30. The numbers are rounded to the 30ths to work them into the 360 circle.
