Graphing Lines Worksheets
How to Graph Lines by Graphing Two Points - There are different methods of plotting a graph. The types of graphs consist of bar graphs, line graphs, pie charts, histograms, and cartesian graphs. A graph is drawn to represent the loci of a moving point in a cartesian grid. Graphs are used to study the behavior of a certain variable in an equation and analyze the trends followed by a certain equation. Drawing a line graph and interpreting it is quite a simple task. When you are solving an equation for the values of its variables, it is possible that for every constant value, you will obtain a different value for the whole equation. These different values are plotted on a cartesian grid system. Once an equation has been solved for the whole range of its given values, the coordinates of its variables are plotted on the cartesian grid. Those coordinates are then joined by straight lines to form a line graph.
-
Basic Lesson
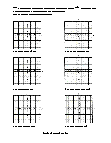
Demonstrates how to solve an equation to graph a line with 2 points. Solve the equation and graph the points and line.
View worksheet -
Independent Practice 1
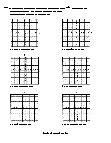
Students solve the equation to graph the two points. The answers can be found below.
View worksheet
Holding Court
An example of the use graphs in real world situations is that lawyers use them in courtrooms to present evidence. Clear and concise charts can help a jury to see a set of events in chronological order.


