Line Plots Worksheets
How to Read Line Plots Math might be a subject that can cause confusion, nervousness, and hesitation. But math is also a subject that has its fair share of definitions and ideas that are fun and interesting. One of the most interesting topics about math are the line plots. Do you know what line plots are? But most importantly, do you know what graphs are? Let's take a look! A visual illustration of data that is too complicated and too detailed to be written in text is known as a graph. And what are line plots? Let's see what it is! Like the name indicates, a line plot is a type of graph which displays data on a number line. Creating a line plot is easy! The first step that you need to take is creating a number line and include all the values in the data. The next step that you need to take is putting an "x" or a dot for each data value on the number line. If a data value is repetitive, place a dot as many times as it occurs.
-
Basic Lesson
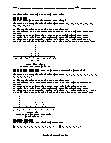
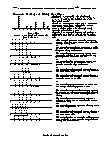
Using a snap shot of random data, students learn to create line plots. What is average number of emails sent today? Construct a line plot for following dataset 14, 14, 15, 15, 15, 15, 15, 15, 16, 16. 1. Set up horizontal axis for this set of data. 2. The lowest is 14 (minimum value) and 16 is the highest (maximum value). 3. Display this segment of a number line along horizontal axis. 4. Place an x above its corresponding value on horizontal axis. 5. Complete the line plot, place an x over 14, another over 14, then 15 and so forth until there is x for each value in the data set.
View worksheet -
Intermediate Lesson
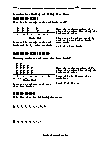
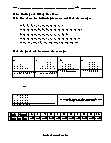
Students read line plots to answer specific questions. What is the average number of books read? Note the maximum number of x above the number line along the horizontal axis. There are 13 readers noted by each x. A total of 40 books were read.
View worksheet -
Independent Practice 1
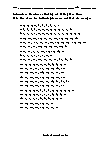
Students create 20 line plots and find the average of each data set. Make line plots for following datasets and find the average.
View worksheet -
Independent Practice 2
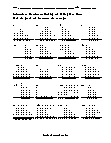
Students read and interpret the average of the line plots. Read the graph and interpret the average.
View worksheet
How Do You Use Them?
X-Y plots are used to determine relationships between the two different things. The x-axis is used to measure one event (or variable) and the y-axis is used to measure the other. It is possible for the events to have a relationship that is positive, negative or non-existent.
