Pictograph Worksheets
How to Read Pictographs - Who says that math is just a boring subject? Math might be confusing, and a very difficult subject to tackle, but there are many topics, definitions, and wonderful things about math that are so fun to learn! Here is a question, do you remember what graphs are? Not to worry! Let’s take a look at what graphs are. Then we can move to learning what a pictograph is and how you can read it for gathering data! Any type of data that is too large and too complicated to be expressed in texts is then explained in visual illustrations. These visual illustrations are known as graphs. A pictograph is a type of graph, and it is incredibly cool! You can learn a lot from looking at a pictograph. Pictographs use symbols and images that are relevant to that data so that you can gain information about the data very easily. Reading pictographs are very easy. There are two axes, the x, and the y-axis, that have the numbers and values. These values represent the data of the question, and the images or symbols represent the highs and lows. The greater the number of images, the greater the value, and the fewer the images, the lower the value.
-
Basic Lesson
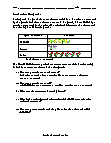
Demonstrates how to read and use a pictograph. A pictograph is a graph that uses pictures to indicate the values represented by the graph. Each time a picture appears in the graph, it is multiplied by a certain amount to give the value. The relationship between the picture and its value is given below the graph.
View worksheet -
Independent Practice 1
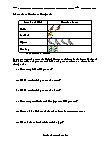
Students answer questions based on a pictograph. The answers can be found below. The Gorham Garden Company asked customers to name their favorite flower. The answers are shown in the pictograph.
View worksheet -
Independent Practice 2
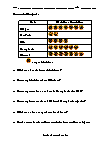
6 pictographs problems. Every year people across the United States participate in the Great Backyard Bird Count. Pretend you counted birds and your numbers are shown in the pictograph.
View worksheet -
Homework Worksheet
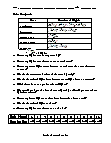
Great practice for after school. Examples are provided. How many more bears are there in Pennsylvania than Ohio?
View worksheet
Charts Help!
Complicated or very detailed information can be hard for some to grasp. Graphs or charts can help by getting that information into a form that is easier to comprehend. Colorful, well thought out pie charts or bar graphs can be most helpful.<


