Plotting Points Worksheets
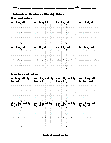
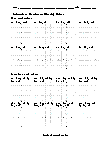
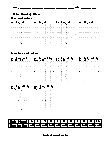
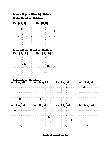
How to Plot Points on a Graph - Cartesian points are written as x, y pairs in parentheses, like so: (x, y). To graph a point, first locate its position on the x-axis, then find its location on the y-axis, and finally plot where these points meet. The center point of the graph is called the origin and is written as the point (0, 0) because it's located at the zero point on the x-axis and the zero point on the y-axis. For example, to plot the point (3, -6), find the positive 3 on the x-axis and the negative 6 on the y-axis.
-
Independent Practice 2
The questions on this one see if they are paying attention to what they are reading.
View worksheet
Visuals Help
It's easier to learn subjects like data analysis, probability, and statistics with visuals found in newspaper graphics, magazine articles, and charts. Kids can use dice, coins, cards or spinners to create data for entering into charts and graphs.


