Stem and Leaf Plots Worksheets
What Are Stem & Leaf Plots? Statistics is that branch of mathematics which makes most of our jobs easier when dealing with complex numbers. Among the different uses, one of the most profound methods of identifying the nature of the values in a sample space, we use stem and leaf plots. Stem and leaf plots are a method to show the frequency with which certain classes of values are identified. Based on the class values, you can make a distribution table, histogram, and other graphs as well. Not to mention the stem and leaf plot as well. Let's take an example where you have the following list of values, 12, 14, 20, 25, 31, 32, 37, 40, 41, and 42. Now, you have to make a stem and leaf plot. Observe the table below.
| Stem | Leaf |
| 1 | 2, 4 |
| 2 | 0, 5 |
| 3 | 1, 2, 7 |
| 4 | 0, 1, 2 |
-
Basic Lesson
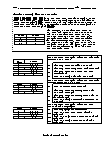
Using a snap shot of random data, students learn to read and make stem and leaf plots. Example: Each morning, a teacher quizzed his class with 20 geography questions. The class marked them together and everyone kept a record of their personal scores. As the year passed, each student tried to improve his or her quiz marks. Every day, Elliot recorded his quiz marks on a stem and leaf plot. This is what his marks looked like plotted out.
View worksheet -
Intermediate Lesson
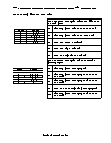
Students begin to make stem and leaf plots. 1. On the left hand side of the page, write down the thousands, hundreds or tens (all digits but the last one). These will be your stem. 2. Draw a line to the right of these stems. On the other side of the line, write down the ones place (last digit of a number). These will be your leaves.
View worksheet -
Independent Practice 1
Students make 20 stem and leaf plots. This stem and leaf plot shows how long (min.) it took each student in a class to complete a home work assignment.
View worksheet
Ever Heard of Scatter Plots?
Scatter plots use horizontal and vertical axes to plot data points. They show how one variable is affected by another: their correlation. The closer the data points come to making a straight line, the higher the correlation between the variables.


