Tally Marks Worksheets
What Are Tally Charts Used For? What is a tally chart? Tally charts are used to collect data quickly and efficiently. Filling in a chart with marks representing numbers is faster than writing out words or figures and the data is collected into sub-groups immediately, making it easy to analyze. A tally chart is a table with tally marks to show a valuable data set. A tally chart is one method of collecting data with tally marks. Tally marks are frequencies, occurrences, or total numbers being measured for a specific category in a data set. Tally charts are used throughout the world and are great visual representations of group observations.
-
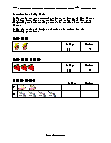
Basic Lesson
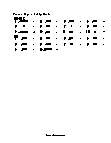
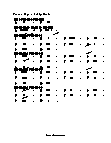
Introduces the use of tally marks and how they relate to numbers. Tally marks are most commonly written as groups of five lines. The first four lines are vertical, and every fifth line runs diagonally or horizontally across the previous four vertical lines.
View worksheet -
Intermediate Lesson
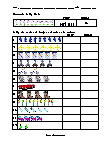
Uses large numbers and introduces grouping of tally marks. Tally the number of images and write the number for the following questions.
View worksheet -
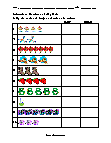
Independent Practice 1
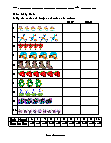
Students tally the number of objects they see and write the corresponding number to the tallies.
View worksheet -
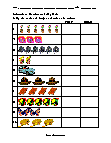
Independent Practice 2
Students tally the number of objects they see and write the corresponding number to the tallies.
View worksheet -
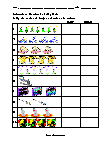
Independent Practice 3
Students tally the number of objects they see and write the corresponding number to the tallies.
View worksheet
What Are Tally Marks?
Tally marks are an easy to keep track of numbers in groups. Tallys usually come in groups of 5. This includes 4 straight lines followed by a 5th mark that appears as a cross out. The cross out was orignal used so that groups of 5 could easily be seen with the eye over long distances.
