Scatter Plots and Line of Best Fit Worksheets
What Are Scatter Plots and Lines of Best Fit? An important concept of statistics, a brand of mathematics, are scatterplots. These are also known as scatter charts and scatter graphs. It is a form of visually display data. It uses dots for the representation of values for two different numeric variables. Each axis, horizontal, and vertical represents values for an individual data point. The purpose of these plots is to find the relationship between two different variables. Besides representing the values of individual data points, scatter plots also displays patterns when the data are taken as a whole. A line that best expresses the relationship between two individual data points is what we call the line of best fit. The lines of best fit are a crucial output of a regression analysis.
-
Basic Lesson
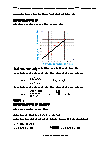
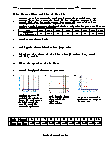
Introduces scatter plots and demonstrates how to draw a line of best fit.
View worksheet -
Intermediate Lesson
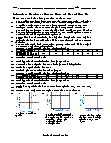
This lesson focuses on calculating slope and applying the Line of Best Fit.
View worksheet -
Independent Practice 1
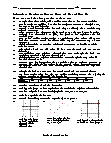
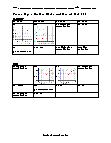
Students practice with 20 Scatter Plots & Line of Best Fit problems. The answers can be found below.
View worksheet -
Independent Practice 2
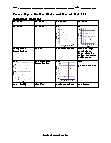
Another 20 Scatter Plots & Line of Best Fit problems. The answers can be found below.
View worksheet -
Homework Worksheet
Reviews all skills in the unit. A great take home sheet. Also provides a practice problem. To help predict values that be not be on the graph we draw a line of best fit. Draw a line that summarizes the trend in the graph. This line can pass through some, all, or none of the plotted points.
View worksheet -
Skill Quiz
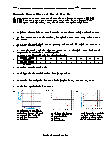
10 problems that test Scatter Plots & Line of Best Fit skills. Example: Variable p is the number of employees trained on new software, and variable q is the number of calls to the computer helpline. You suspect that more training reduces the number of calls. Does this follow positive correlation or negative correlation?
View worksheet
Here's a fun game to play when you are bored:
try and guess how many words you can make by using any of the eleven letters in the word PROBABILITY. Remember: you can only use each letter as many times as it appears in the word probability. Try it and see how many words you can come up with. Then compare your findings with a friend.

