Regression Analysis Worksheets
What is Regression Analysis? Regression analysis is a commanding arithmetical method that lets you inspect the relationship amongst two or more variables of interest. Though there are numerous types of regression analysis, at their core they all scrutinize the effect of one or more self-governing variables on a dependent one. In simple terms the purpose of regression analysis is to forecast a result built on a historical data. Thus, regression analysis is used to predict the conduct of a dependent variable based on the behavior of a few or large number of independent variables (age, height, financial status). The word "regression" was devised by Francis Galton in the 19th century to describe a biological singularity. The phenomenon was the heights of progenies of giant descendants tend to retreat down towards an average. A phenomenon or singularity is known as regression as well, toward the mean.
-
Basic Lesson
Guides students solving equations that involve an Regression Analysis. Demonstrates answer checking. The closer this value is to 1, the more accurate your model will be when used for predictions. This model will be a good predictor.
View worksheet -
Intermediate Lesson
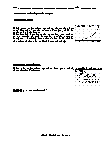
Demonstrates how to solve more difficult problems. Using your regression equation, determine how many bacteria, to the nearest integer, will be present in 3.5 hours. Substituting 3.5 into the equation, we arrive at an answer of 203 bacteria, to the nearest integer. Looking for values that fall within the plotted data is called interpolating.
View worksheet -
Independent Practice 1
A really great activity for allowing students to understand the concept of Regression Analysis. Notice that both the exponential and the power regression models showed high correlation coefficients, but examination of the graph showed that the exponential model was the better fit.
View worksheet -

Independent Practice 2
Students find the Regression Analysis in assorted problems. The answers can be found below. The table shows the amount of medicine for treating a disease in the bloodstream over the 9 hours following a dose of 12 mg. It seems that the rate of decrease of the drug is approximately proportional to the amount remaining.
View worksheet -

Independent Practice 3
A really great activity for allowing students to understand the concept of regression analysis. A factory is producing and stockpiling metal sheets to be shipped to an automobile manufacturing plant. The factory ships only when there is a minimum of 1658 sheets in stock at the beginning of that day. The table shows the day, x, and the number of sheets in stock, f (x), at the beginning of that day.
View worksheet -

Independent Practice 4
Students find the uses for regression analysis in assorted problems. The answers can be found below. The table shows the amount of medicine for treating a disease in the bloodstream over the 9 hours following a dose of 10.2 mg. It seems that the rate of decrease of the drug is approximately proportional to the amount remaining.
View worksheet -

Homework Worksheet
Students are provided with problems to achieve the concepts of Regression Analysis. Write the regression equation for your model, rounding values to three decimal places.
View worksheet -
Skill Quiz
This tests the students ability to evaluate data using regression analysis.
View worksheet -

Thoughts From Martin Gardner
All mathematicians share ... a sense of amazement over the infinite depth and the mysterious beauty and usefulness of mathematics.