Tree Diagram Worksheets
What Are Tree Diagrams Used For?
Statistics consist of different tools and methods which allow us to perform different forecasting procedures. Among those methods, the use of tree diagrams is extensive in present complex calculations. By definition, a tree diagram is just a way to represent a sequence of events. They are specifically preferable in probability since they record all the possible outcomes in a concise and comprehensive manner. Moreover, it helps in uncomplicating probabilities, which are quite hard at times, and often it is hard to figure out what to do.
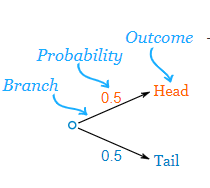
Let us consider the example of a simple coin toss. In this scenario, there are two branches (heads or tails). The probability of each branch is written on the branch itself. The outcome is written at the end of the branch. Look at the tree diagram below.
-

Basic Lesson
Using a snap shot of random data, students learn to read and interpret tree diagrams. A tree diagram is a way to list all possible outcomes of an event. Show the sample space for tossing one penny and rolling one die.
View worksheet -

Intermediate Lesson
Students begin to deploy and interpret tree diagrams. Bag A contains three red marbles and four blue marbles. Bag B contains five red marbles and three blue marbles. A marble is taken from each bag in turn.
View worksheet -
Independent Practice 1
Students create 20 tree diagrams. Example: Each spinner is spun once. How many outcomes are possible if spinner 1 is half blue and half orange, and spinner 2 has three equal sections labeled A, B and C. Draw a tree diagram.
View worksheet -
-
-
-
-
What Are Area Graphs?
Area graphs are very similar to line graphs. They can be used to track changes over time for one or more groups. Area graphs are good to use when you are tracking the changes in two or more related groups that make up one whole category (for example public and private groups).