Frequency Tables Worksheets
How to Read Frequency Tables - In statistics, we often come across a term called frequency. In general, the term frequency refers to the quantity or amount of something or the number of times an event has occurred. The frequency of the number of any object or the number of occurrences of any event is plotted on a frequency table. A frequency table records the frequency of anything within a class boundary. A class boundary segregates the number of occurrences of certain events according to different categories and classifies every occurrence in their respective categories. Reading a frequency table is a pretty simple task. The quantity of something or the number of occurrences of any event is mostly written in numeric form. For example, if a class has 7 students who have a height lying in the range of 5 to 6 feet, then the class of height 5 to 6 feet will have a frequency of 7. Sometimes, we also draw tally marks to represent the frequency of anything in a frequency table.
-
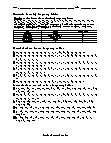
Basic Lesson
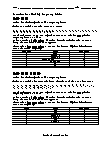
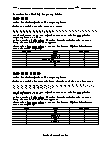
Using a snap shot of random data, students learn to read frequency tables. Record the following data into a frequency table. Below is a list of all shoe sizes in a class. The lowest number is 1. The highest number is 8. Shoe the range of our frequency table is 1 to 8. We then create a tally column to record the data from the set. We mark a tally for each time a shoe size appears. Now create a frequency column. Add all the tallies together to determine each shoe size's frequency.
View worksheet -
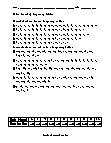
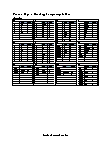
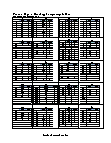
Independent Practice 1
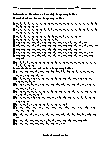
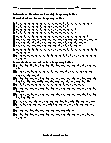
Students create 20 frequency tables. Record the data into a frequency table.
View worksheet
What Does a Straight Line on a Graph Tell Us?
Two quantities which are in direct proportion will always produce a graph where all the points can be joined to form a straight line.
