Reading Data Tables Worksheets
How to Read Data Tables - When students are introduced to the concept of graphing, they come across data tables. These tables have a high significance in not only mathematics but also daily lives. In order to learn graphing skills, students need to have a clear understanding of what data tables are and how to read them. Data tables comprise of two quantities: an independent quantity and a dependent quantity. These display the corresponding values of two variables. The tables can be read from left to right or from top to bottom. When you read a table down a column or across a row, it can help you create a graph.
-

Basic Lesson
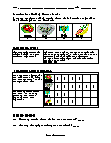
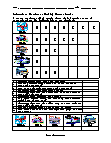
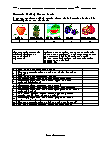
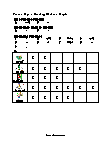
Students learn to make sense of data from a survey. A survey was done asking people about their favorite vegetable. The following data was obtained.
View worksheet -
Intermediate Lesson
Students begin to answer higher level questions based on data tables. How many people did not choose carrot as their favorite vegetable? From the table above, we infer that out of total i.e. 15 people, 3 chose carrot and the remaining chose some other vegetable. so the remaining people who did not chose carrot are 15 - 3 = 12.
View worksheet -
Independent Practice 1
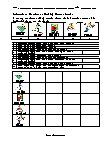
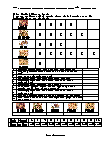
Students answer 10 questions and react based on a survey. A survey was done asking people about their favorite sport. The following data was obtained.
View worksheet -
Independent Practice 2
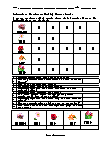
Given a X horizontal picture graph, students answer questions and form a data table.
View worksheet -
-
Independent Practice 4
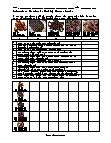
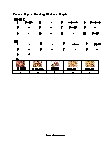
A survey on means of transportation is examined with the use of a data table.
View worksheet -
-
Skill Quiz
Students answer 10 quiz questions based on data from a survey on favorite types of nuts.
View worksheet -
-
Want to amaze your friends?
Have a friend pick any 4 numbers that form a square on the calendar and give you the sum of the numbers. You divide that number by 4 & subtract 4 to get the base number. Add the numbers 1, 7, and 8 to it to get the other numbers.