Percentiles and Quartiles Worksheets
What Are Percentiles and Quartiles? At a glance, percentile comes of a term that is strictly used in statistics. However, we use percentile almost every day of our lives. We use percentiles to know our test scores, to read the health indicators in a better way, and make several other measurements regularly. In statistics, percentiles are used to interpret and understand a set of data. The nth percentile is the value below which a percentage of data in a data is present. For instance, a 25 years old male measuring six feet height lies in the 70th percentile for this height. It means of all the 25 years old male; 70 percent measures equal to or less than six feet. Quartiles are used in statistics to group or summarize the set of numbers. Quartiles are the group of five numbers that we use to break a data set into four groups. The five numbers are listed below: Minimum or the 0th percentile, it is known as the smallest number in the group. 1st quartile or the 25th percentile, it is the number that splits the lowest 25th of the group from the highest 75th Median or the 50th percentile, it is the number present in the middle of the group 3rd quartile or the 75th percentile, it is the number that separates the lowest 75th of the group from the highest 25th of the group Maximum or the 100th percentile, it is the largest number of the group.
-
Basic Lesson
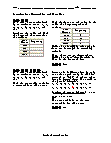
Introduces the concept of median and percentile rank. In a test, scores obtained by 11 students were: 4, 4, 5, 6, 7, 8, 9, 9, 10, and 10. Complete the table and find the interval that contains the median.
View worksheet -

Intermediate Lesson
This lesson focuses on determining the significance of student test data.
View worksheet -

Independent Practice 1
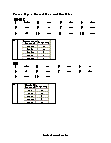
Students practice with 20 Percentiles & Quartiles problems. The answers can be found below. Locate the 9. Since there are 2 values equal to 9, assign one to the group "above 84" and the other to the group "below 84".
View worksheet -

Independent Practice 2
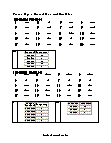
Another 20 Percentiles & Quartiles problems. The answers can be found below.
View worksheet -

Homework Worksheet
Reviews all skills in the unit. A great take home sheet. Also provides a practice problem.
View worksheet -

-
-
Quick Tip
Every time you roll a die, your probability of getting a particular number remains the same. Why? Each time you roll the die you have a one in six chance of getting any one number, so with each roll you are just as likely to get a 1, 2, 3, 4, 5 or six as you were with your first roll, as your fiftieth or one hundredth roll.