Central Tendency and Dispersion Worksheets
What is the Difference Between Central Tendency and Dispersion? A measure of central tendency is the single value that represents how a data set groups around the central value. In simpler terms, the measure of central tendency defines the center of the data set. Typically, there are three measures of central tendency, namely, mean, median, and mode. Each of these measurements provides us with valuable information about the data set. We can use this information to how data points are related to each other in the data set. Mean - Mean or more commonly known as the average value is calculated by adding all the given data points and dividing them by the numbers of given data points. For example, we have values 2, 4, 6, 8, and 10. To find the mean of these values, we will first add all the values. 2 + 4 + 6+ 8 + 10, we will get 30. Then we will divide 30 with the number of given addends, which is 5 in this case. The mean we will get is 30/5 = 6. Median - Median is the number present in the middle of a given data set. That means it has an equal number of data points below and above it. For example, if few take the same data points, 2, 4, 6, 8, and 10. In this case, the median is 6, as it has an equal number of data points both above and below it. Mode - The mode tells us the number with the highest frequency that is it occurred the most in a data set. In our example, 2, 4, 6, 8, and 10, each number is present one time only; hence there is no mode in this data set. Dispersion - In statistics, dispersion is defined as the way of determining the size of distribution or spread out data is. A data set tends to be widely scattered when it has large values. However, the data remains tightly clustered when it has small values. For example, data with large values can look like 0, 1, 20, 30, 40, 100, and a data set with small values can be 1, 2, 3, 4, 5. Standard Deviation: it shows are spread the values of data set are from the mean. Index of Dispersion: this dispersion measure is used with nominal variables. Mean Difference: it shows the difference between the mean values of two data sets.
-
Basic Lesson
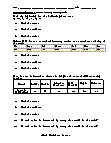
Guides students solving equations that involve an Central Tendency and Dispersions. Demonstrates answer checking. For what value of x will 9, 16 and x have the same mean (average) as that of 26 and 12?
View worksheet -
Intermediate Lesson
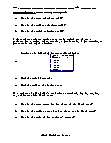
Demonstrates how to solve more difficult problems. For the above question, what is the model price for chocolate? $2.5 appears maximum number of times (2 times), so model price is $2.50.
View worksheet -
Independent Practice 1
A really great activity for allowing students to understand the concept of Central Tendency and Dispersions. Videos R Us keeps a record of how many movies are rented on each day of the week.
View worksheet -
Independent Practice 2
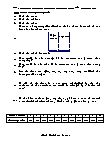
Students find the Central Tendency and Dispersions in assorted problems. The answers can be found below. You phone bill tells you the amount of time you spent on the phone for each call. You have 8 calls that were 12 minutes long, 4 calls that were 23 minutes long, 1 call that was 45 minutes long.
View worksheet -
Homework Worksheet
Students are provided with problems to achieve the concepts of Central Tendency and Dispersions. If the number of days per month that had a temperature above 40 degrees C, doubles each month in that year, what will be the median for the data?
View worksheet -
Skill Quiz
This tests the students ability to evaluate Central Tendency and Dispersions.
View worksheet
Question: What is the opposite of a stop sign?
Answer: a cosine (a go sign!)


