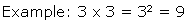
In mathematics squaring is really easy to understand. Squaring a
number means multiplying it by itself. Squaring is written in mathematical
symbols by putting a 2 above the number you are squaring to show that
it is multiplied 2 times.
Square root is more complicated to understand. When you calculate
the square root of a number you want to find the original number that
was squared. So the square root of 9 is 3. Squares and square roots
come in pairs. In this example 3 squared is 9 and the square root
of 9 is 3.
Squares are always easy to calculate but finding a square root is
complicated. Square roots are complicated because the square root
of a number is frequently a long decimal number. The square root of
4 (2 x 2), 9 (3 x 3) or 256 (16 x 16) are easy to find. But what about
the square root of 5? The square root of 5 is 2.236! Check this out
for yourself by squaring 2.236. Imagine how complicated the square
root of a very big number becomes! There are different methods for
calculating square roots but you will usually use a table or calculator
when you need to find a square root.
If square roots are so complicated, why is it important for you to
learn about them? One reason is that square roots are used all the
time by scientists, engineers and even people who work in factories.
Before learning any more about square roots you need to learn about
the normal distribution.
Normal Distribution
The normal distribution is a way of looking at variety in a group
of similar things. Let's look at an example. Think about all the students
in your class. Even though everyone is just about the same age, students
have different heights. Someone is the tallest, someone is the shortest
and the rest of the class is about the same height.
If you write down the height of everyone in the class and then put
the heights in order from shortest to tallest, you can count how many
students are each height. Your list might come out something this:
4 feet tall - 1 (shortest)
4 feet 1 inch - 2
4 feet 2 inches - 3
4 feet 3 inches - 5
4 feet 4 inches - 8
4 feet 5 inches - 7
4 feet 6 inches - 4
4 feet 7 inches - 2
4 feet 8 inches - 1 (tallest)
You can see that most of the heights are between 4 feet 3 inches
and 4 feet 5 inches and a few are shorter and just a few are taller.
In mathematics and statistics this is called a normal distribution
and a sample graph of a normal distribution is shown below.
A normal distribution shows the how many in the group being looked
at, called the population, have each value. In this example, the population
is the students in your class and what is being measured is the height.
While this graph doesn't exactly match the numbers we made up for
the example, it shows what a typical normal distribution looks like.
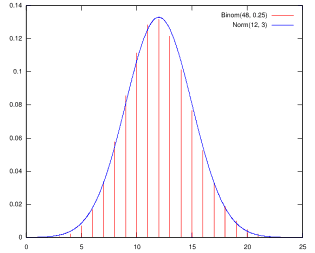
Example of Normal Distribution
In a normal distribution, there are values at each end of the graph
that indicate that only a few members of the population have that
value and these are called the tails of the normal distribution. For
this example, the shortest members of the class are counted on the
left and the tallest are counted on the right. Everyone else is counted
in the middle of the graph.
Squares, Square Root and Normal Distribution
In the real world people are interested in finding out what values
are "normal" and what values are outside of normal, those values that
are in the tails of the distribution. Students can't control how tall
they grow so you don't want to call the shortest and tallest kids
in your class abnormal! Student height was just an easy example to
look at and understand.
But many factories use the normal distribution to make sure that
the products that they are making are of good quality. The business
people at the factory develop a normal distribution of the product
and do not sell any items that measure in the tails of the distribution.
There are lots of other uses for the normal distribution; factories
are just one simple example.
What does the normal distribution have to do with squares and square
roots? Plenty! The equations for finding the tails of the normal distribution
use squares and square roots!